June Unemployment Inches Downward
Jul. 20, 2001
No. 01-70
 Alaska's
statewide unemployment rate dropped just a tenth of a percentage point
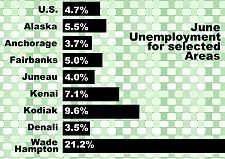
in June to 5.5%. This is nearly a full percentage point below the year-ago
level, and the number of unemployed Alaskans was 2,600 lower than last
June. The comparable national unemployment rate in June was 4.7%.
Alaska's
statewide unemployment rate dropped just a tenth of a percentage point
in June to 5.5%. This is nearly a full percentage point below the year-ago
level, and the number of unemployed Alaskans was 2,600 lower than last
June. The comparable national unemployment rate in June was 4.7%.
June's unemployment rate, like the rates of the past three years, remains near record lows. Some of the explanation for Alaska's tight labor market has been the booming national economy that has created some of the lowest unemployment rates in three decades. But this could change, according to Neal Fried, a labor economist with the Alaska Department of Labor and Workforce Development. The nation's unemployment is beginning to rise, and recent large layoffs around the nation could eventually spell higher rates of unemployment in Alaska if more residents in the lower 48 states look north.
Most of the areas in the state experienced relatively small changes in unemployment in June. In many cases unemployment fell as the construction, fishing and visitor industries began to move into their busiest season. The Denali Borough's unemployment fell the most dramatically from 6.7% in May to 3.5% in June. The area's large, highly seasonal visitor industry, anchored by Denali National Park, accounts for most of this change. Denali Borough also had the state's lowest jobless rate in June.
Nearly all the regions in the state also experienced lower rates this year than in June of 2000. One exception was the Southwest region, where the unemployment rate actually increased by 1.1 percentage points in June and was slightly higher than year-ago levels. The main reason for the region's lackluster performance was weaker fisheries. The highest unemployment rate was in the Wade Hampton Census area at 21.2%. Wade Hampton is an area of 13 small communities, most of them on the Yukon Delta, where employment opportunities are scarce year-round.
Accompanying the slight drop in June's jobless rate was the addition of 9,400 wage and salary jobs to the state's economy. The number of jobs is running 2,600 ahead of year-ago levels, or less than one percent. Most of the explanation for this weaker over-the-year growth is the very soft manufacturing sector. Timber's employment is down nearly 31 percent compared to year-ago levels. With the salmon season off to a slow start, seafood processing is down 14 percent or 1,400 jobs. Employment gains in the oil and construction industries are helping to lighten these losses. Since both oil and construction are high-wage industries, they are giving the economy some quality punch. Strong growth in the service industry is also providing a big boost to the labor market.
|
Labor
Force by Region and Census Area
|
||||||||||||
| Labor Force | Unemployment | Rate | Employment | |||||||||
| 1-Jun | 1-May | Jun-00 | 1-Jun | 1-May | Jun-00 | 1-Jun | 1-May | Jun-00 | 1-Jun | 1-May | Jun-00 | |
| Alaska Statewide | 336,521 | 327,738 | 329,610 | 18,619 | 18,439 | 21,256 | 5.5 | 5.6 | 6.4 | 317,902 | 309,299 | 308,354 |
| Anchorage/Mat-Su Region | 182,273 | 178,853 | 176,508 | 7,702 | 7,568 | 9,212 | 4.2 | 4.2 | 5.2 | 174,571 | 171,285 | 167,296 |
| Municipality of Anchorage | 147,775 | 146,325 | 144,014 | 5,494 | 5,496 | 6,748 | 3.7 | 3.8 | 4.7 | 142,281 | 140,829 | 137,266 |
| Mat-Su Borough | 34,498 | 32,528 | 32,494 | 2,208 | 2,072 | 2,464 | 6.4 | 6.4 | 7.6 | 32,290 | 30,456 | 30,030 |
| Gulf Coast Region | 36,417 | 33,915 | 36,581 | 2,723 | 2,949 | 3,082 | 7.5 | 8.7 | 8.4 | 33,694 | 30,966 | 33,499 |
| Kenai Peninsula Borough | 23,250 | 21,593 | 23,175 | 1,651 | 1,743 | 1,701 | 7.1 | 8.1 | 7.3 | 21,599 | 19,850 | 21,474 |
| Kodiak Island Borough | 7,737 | 7,201 | 8,006 | 745 | 775 | 1,055 | 9.6 | 10.8 | 13.2 | 6,992 | 6,426 | 6,951 |
| Valdez-Cordova | 5,429 | 5,121 | 5,400 | 326 | 431 | 326 | 6 | 8.4 | 6 | 5,103 | 4,690 | 5,074 |
| Interior Region | 51,928 | 50,924 | 51,242 | 2,886 | 2,942 | 3,413 | 5.6 | 5.8 | 6.7 | 49,042 | 47,982 | 47,829 |
| Denali Borough | 1,157 | 1,171 | 1,131 | 41 | 79 | 43 | 3.5 | 6.7 | 3.8 | 1,116 | 1,092 | 1,088 |
| Fairbanks North Star Borough | 45,847 | 44,904 | 45,235 | 2,303 | 2,301 | 2,768 | 5 | 5.1 | 6.1 | 43,544 | 42,603 | 42,467 |
| Southeast Fairbanks | 2,679 | 2,623 | 2,647 | 221 | 218 | 250 | 8.2 | 8.3 | 9.4 | 2,458 | 2,405 | 2,397 |
| Yukon-Koyukuk | 2,246 | 2,226 | 2,228 | 322 | 344 | 352 | 14.3 | 15.5 | 15.8 | 1,924 | 1,882 | 1,876 |
| Northern Region | 9,258 | 9,243 | 8,701 | 1,150 | 1,044 | 1,200 | 12.4 | 11.3 | 13.8 | 8,108 | 8,199 | 7,501 |
| Nome | 3,501 | 3,484 | 3,296 | 461 | 410 | 484 | 13.2 | 11.8 | 14.7 | 3,040 | 3,074 | 2,812 |
| North Slope Borough | 3,452 | 3,462 | 3,283 | 320 | 295 | 385 | 9.3 | 8.5 | 11.7 | 3,132 | 3,167 | 2,898 |
| Northwest Arctic Borough | 2,305 | 2,297 | 2,122 | 369 | 339 | 331 | 16 | 14.8 | 15.6 | 1,936 | 1,958 | 1,791 |
| Southeast Region | 41,435 | 40,267 | 41,197 | 2,250 | 2,282 | 2,486 | 5.4 | 5.7 | 6 | 39,185 | 37,985 | 38,711 |
| Haines Borough | 1,262 | 1,239 | 1,234 | 78 | 92 | 65 | 6.2 | 7.4 | 5.3 | 1,184 | 1,147 | 1,169 |
| Juneau Borough | 18,091 | 17,530 | 17,959 | 725 | 696 | 803 | 4 | 4 | 4.5 | 17,366 | 16,834 | 17,156 |
| Ketchikan Gateway Borough | 8,002 | 7,785 | 7,936 | 482 | 495 | 507 | 6 | 6.4 | 6.4 | 7,520 | 7,290 | 7,429 |
| Pr. of Wales-Outer Ketchikan | 3,303 | 3,203 | 3,364 | 338 | 328 | 435 | 10.2 | 10.2 | 12.9 | 2,965 | 2,875 | 2,929 |
| Sitka Borough | 4,538 | 4,389 | 4,567 | 172 | 157 | 254 | 3.8 | 3.6 | 5.6 | 4,366 | 4,232 | 4,313 |
| Skagway-Hoonah-Angoon | 2,211 | 2,152 | 2,153 | 162 | 165 | 128 | 7.3 | 7.7 | 5.9 | 2,049 | 1,987 | 2,025 |
| Wrangell-Petersburg | 3,689 | 3,632 | 3,645 | 249 | 297 | 246 | 6.7 | 8.2 | 6.7 | 3,440 | 3,335 | 3,399 |
| Yakutat Borough | 339 | 337 | 338 | 45 | 52 | 47 | 13.3 | 15.4 | 13.9 | 294 | 285 | 291 |
| Southwest Region | 15,208 | 14,536 | 15,380 | 1,907 | 1,655 | 1,863 | 12.5 | 11.4 | 12.1 | 13,301 | 12,881 | 13,517 |
| Aleutians East Borough | 1,522 | 1,467 | 1,547 | 70 | 61 | 72 | 4.6 | 4.2 | 4.7 | 1,452 | 1,406 | 1,475 |
| Aleutians West | 2,121 | 1,989 | 2,043 | 289 | 214 | 181 | 13.6 | 10.8 | 8.9 | 1,832 | 1,775 | 1,862 |
| Bethel | 6,388 | 6,124 | 6,497 | 793 | 706 | 811 | 12.4 | 11.5 | 12.5 | 5,595 | 5,418 | 5,686 |
| Bristol Bay Borough | 478 | 459 | 513 | 38 | 33 | 66 | 7.9 | 7.2 | 12.9 | 440 | 426 | 447 |
| Dillingham | 1,784 | 1,729 | 1,818 | 163 | 159 | 170 | 9.1 | 9.2 | 9.4 | 1,621 | 1,570 | 1,648 |
| Lake & Peninsula Borough | 612 | 589 | 624 | 66 | 60 | 69 | 10.8 | 10.2 | 11.1 | 546 | 529 | 555 |
| Wade Hampton | 2,302 | 2,179 | 2,338 | 488 | 422 | 494 | 21.2 | 19.4 | 21.1 | 1,814 | 1,757 | 1,844 |
|
Alaska
Nonagricultural Wage & Salary Employment
|
|||||
| preliminary | revised | Changes from: | |||
| 1-Jun | 1-May | Jun-00 | 1-May | Jun-00 | |
| Total Nonagricultural Employment | 301,000 | 291,600 | 298,400 | 9,400 | 2,600 |
| Mining | 11,600 | 11,300 | 10,000 | 300 | 1,600 |
| Construction | 17,100 | 14,900 | 16,600 | 2,200 | 500 |
| Manufacturing | 13,500 | 11,800 | 15,400 | 1,700 | -1,900 |
| Transportation, Commun. & Utilities | 29,300 | 28,200 | 29,500 | 1,100 | -200 |
| Trade | 61,700 | 58,800 | 61,200 | 2,900 | 500 |
| Finance, Insurance & Real Estate | 13,100 | 12,700 | 13,200 | 400 | -100 |
| Services & Misc. | 81,100 | 76,500 | 79,000 | 4,600 | 2,100 |
| Government | 73,600 | 77,400 | 73,500 | -3,800 | 100 |
|
Seasonally
Adjusted Unemployment Rates
|
||
| June 2001: | Alaska 5.8% | U.S. 4.5% |
| May 2001: | Alaska 5.6% | U.S. 4.4% |
| June 2000: | Alaska 6.8% | U.S. 4.0% |
Benchmark: March 2000 Source: Alaska Department of Labor and Workforce Development, Research and Analysis Section.
- Comparisons between different time periods are not as meaningful as other time series produced by Research and Analysis.
- The official definition of unemployment currently in place excludes anyone who has not made an active attempt to find work in the four-week period up to and including the week that includes the 12th of the reference month. Due to the scarcity of employment opportunities in rural Alaska locations, many individuals do not meet the official definition of unemployed because they have not conducted an active job search. These individuals are considered not in the labor force.
###