Alaska Unemployment Drops to 6.1% in May
Jun. 16, 2000
No. 00-55
 Regionally,
unemployment was mixed. Four of the state's six regions showed unemployment
drops, while the Northern Region and Southwest Alaska posted higher unemployment
rates. "The beginning of the peak visitor season and a vigorous
construction industry brightened the state's unemployment picture,"
Boucher commented. "Most of urban Alaska geared up for the tourism season
and another solid construction season."
Regionally,
unemployment was mixed. Four of the state's six regions showed unemployment
drops, while the Northern Region and Southwest Alaska posted higher unemployment
rates. "The beginning of the peak visitor season and a vigorous
construction industry brightened the state's unemployment picture,"
Boucher commented. "Most of urban Alaska geared up for the tourism season
and another solid construction season."
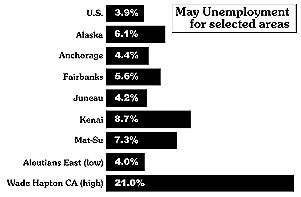
The Kodiak Island Borough, Southwestern Alaska and Northern Alaska were exceptions to the trend of dropping unemployment rates. A slowdown in employment related to the winter fisheries caused higher unemployment in Kodiak and Southwest Alaska. The end of the winter oil drilling and construction season was a major cause of increased unemployment in Northern Alaska. The highest unemployment rate in Alaska was in the Wade Hampton Census Area at 21.0%, while the lowest was in the Aleutians East Borough at 4.0%.
Wage and salary employment statistics helped explain the sharp drop in the unemployment rate. There were 11,000 more wage and salary jobs available in the state than in April. Retail trade, tourist-related services, construction and the transportation industry contributed most of the job growth. Manufacturing employment losses were restricted to Southwestern Alaska and Kodiak, where seafood processing plants geared down after the winter fisheries. Federal government employment gains related to temporary workers hired for the 2000 Census accounted for most of the government employment gains seen from April to May.
Labor Force By Region and Census Area
|
Labor Force |
Unemployment |
Rate |
Employment |
|||||||||
| May-00 | Apr-00 | May-99 | May-00 | Apr-00 | May-99 | May-00 | Apr-00 | May-99 | May-00 | Apr-00 | May-99 | |
| Alaska Statewide | 320,776 | 314,797 | 314,244 | 19,604 | 20,883 | 21,166 | 6.1 | 6.6 | 6.7 | 301,172 | 293,914 | 293,078 |
| Anchorage /Mat-Su Region |
173,715 | 172,407 | 168,498 | 8,484 | 9,129 | 9,107 | 4.9 | 5.3 | 5.4 | 165,231 | 163,278 | 159,391 |
| Municipality of Anchorage | 142,497 | 141,936 | 139,186 | 6,207 | 6,586 | 6,578 | 4.4 | 4.6 | 4.7 | 136,290 | 135,350 | 132,608 |
| Mat-Su Borough | 31,218 | 30,471 | 29,312 | 2,277 | 2,543 | 2,529 | 7.3 | 8.3 | 8.6 | 28,941 | 27,928 | 26,783 |
| Gulf Coast Region | 33,787 | 32,412 | 34,018 | 2,908 | 3,222 | 3,691 | 8.6 | 9.9 | 10.9 | 30,879 | 29,190 | 30,327 |
| Kenai Peninsula Borough | 21,460 | 20,836 | 21,466 | 1,873 | 2,321 | 2,229 | 8.7 | 11.1 | 10.4 | 19,587 | 18,515 | 19,237 |
| Kodiak Island Borough | 7,180 | 6,614 | 7,483 | 633 | 425 | 1,053 | 8.8 | 6.4 | 14.1 | 6,547 | 6,189 | 6,430 |
| Valdez-Cordova | 5,147 | 4,961 | 5,069 | 402 | 475 | 409 | 7.8 | 9.6 | 8.1 | 4,745 | 4,486 | 4,660 |
| Interior Region | 51,122 | 48,789 | 50,056 | 3,248 | 3,469 | 3,347 | 6.4 | 7.1 | 6.7 | 47,874 | 45,320 | 46,709 |
| Denali Borough | 1,215 | 1,206 | 1,196 | 71 | 123 | 80 | 5.8 | 10.2 | 6.7 | 1,144 | 1,083 | 1,116 |
| Fairbanks North Star Borough | 45,106 | 42,998 | 44,209 | 2,539 | 2,702 | 2,678 | 5.6 | 6.3 | 6.1 | 42,567 | 40,296 | 41,531 |
| Southeast Fairbanks | 2,607 | 2,509 | 2,516 | 257 | 285 | 223 | 9.9 | 11.4 | 8.9 | 2,350 | 2,224 | 2,293 |
| Yukon-Koyukuk | 2,194 | 2,075 | 2,134 | 381 | 359 | 365 | 17.4 | 17.3 | 17.1 | 1,813 | 1,716 | 1,769 |
| Northern Region | 8,527 | 8,657 | 8,234 | 1,026 | 934 | 998 | 12 | 10.8 | 12.1 | 7,501 | 7,723 | 7,236 |
| Nome | 3,264 | 3,300 | 3,146 | 444 | 396 | 426 | 13.6 | 12 | 13.5 | 2,820 | 2,904 | 2,720 |
| North Slope Borough | 3,190 | 3,242 | 3,055 | 293 | 259 | 260 | 9.2 | 8 | 8.5 | 2,897 | 2,983 | 2,795 |
| Northwest Arctic Borough |
2,073 | 2,116 | 2,033 | 289 | 279 | 312 | 13.9 | 13.2 | 15.3 | 1,784 | 1,837 | 1,721 |
| Southeast Region | 39,677 | 37,867 | 39,530 | 2,313 | 2,678 | 2,548 | 5.8 | 7.1 | 6.4 | 37,364 | 35,189 | 36,982 |
| Haines Borough | 1,176 | 1,167 | 1,219 | 80 | 135 | 134 | 6.8 | 11.6 | 11 | 1,096 | 1,032 | 1,085 |
| Juneau Borough | 17,249 | 16,298 | 17,132 | 721 | 732 | 773 | 4.2 | 4.5 | 4.5 | 16,528 | 15,566 | 16,359 |
| Ketchikan Gateway Borough | 7,296 | 7,034 | 7,246 | 470 | 605 | 490 | 6.4 | 8.6 | 6.8 | 6,826 | 6,429 | 6,756 |
| Pr. of Wales-Outer Ketchikan | 3,380 | 3,250 | 3,408 | 412 | 455 | 470 | 12.2 | 14 | 13.8 | 2,968 | 2,795 | 2,938 |
| Sitka Borough | 4,430 | 4,188 | 4,423 | 201 | 205 | 237 | 4.5 | 4.9 | 5.4 | 4,229 | 3,983 | 4,186 |
| Skagway -Hoonah-Angoon |
2,255 | 2,170 | 2,237 | 111 | 151 | 115 | 4.9 | 7 | 5.1 | 2,144 | 2,019 | 2,122 |
| Wrangell-Petersburg | 3,557 | 3,444 | 3,536 | 275 | 353 | 288 | 7.7 | 10.2 | 8.1 | 3,282 | 3,091 | 3,248 |
| Yakutat Borough | 335 | 315 | 328 | 44 | 41 | 40 | 13.1 | 13 | 12.2 | 291 | 274 | 288 |
| Southwest Region | 13,948 | 14,665 | 13,908 | 1,625 | 1,451 | 1,475 | 11.7 | 9.9 | 10.6 | 12,323 | 13,214 | 12,433 |
| Aleutians East Borough |
1,448 | 1,532 | 1,482 | 58 | 41 | 79 | 4 | 2.7 | 5.3 | 1,390 | 1,491 | 1,403 |
| Aleutians West | 1,841 | 1,919 | 1,834 | 159 | 115 | 137 | 8.6 | 6 | 7.5 | 1,682 | 1,804 | 1,697 |
| Bethel | 5,786 | 6,067 | 5,764 | 683 | 596 | 616 | 11.8 | 9.8 | 10.7 | 5,103 | 5,471 | 5,148 |
| Bristol Bay Borough | 567 | 629 | 558 | 47 | 71 | 33 | 8.3 | 11.3 | 5.9 | 520 | 558 | 525 |
| Dillingham | 1,669 | 1,776 | 1,668 | 177 | 176 | 162 | 10.6 | 9.9 | 9.7 | 1,492 | 1,600 | 1,506 |
| Lake & Peninsula Borough |
554 | 586 | 544 | 63 | 60 | 49 | 11.4 | 10.2 | 9 | 491 | 526 | 495 |
| Wade Hampton | 2,082 | 2,156 | 2,059 | 438 | 393 | 400 | 21 | 18.2 | 19.4 | 1,644 | 1,763 | 1,659 |
Alaska Nonagricultural Wage & Salary Employment
| preliminary | revised | Changes from: |
|||
| May-00 | Apr-00 | May-99 | Apr-00 | May-99 | |
| Total Nonagricultural Employment | 286,600 | 275,600 | 281,600 | 11,000 | 5,000 |
| Mining | 9,800 | 9,700 | 9,700 | 100 | 100 |
| Construction | 14,300 | 12,500 | 13,800 | 1,800 | 500 |
| Manufacturing | 12,200 | 12,900 | 12,900 | -700 | -700 |
| Transportation, Commun. & Utilities | 27,800 | 25,700 | 26,600 | 2,100 | 1,200 |
| Trade | 58,300 | 55,600 | 57,800 | 2,700 | 500 |
| Finance, Insurance & Real Estate | 12,800 | 12,700 | 12,800 | 100 | 0 |
| Services & Misc. | 73,700 | 70,300 | 71,600 | 3,400 | 2,100 |
| Government | 77,700 | 76,200 | 76,400 | 1,500 | 1,300 |
Government includes employees of
public schools and the University of Alaska.
Benchmark date: March 1998
Source: Alaska Department of Labor and Workforce Development, Research and Analysis Section.
###